
Exponent Philanthropy is proud to release the latest edition of the Foundation Operations and Management Report (FOMR). This premier benchmarking resource offers mission-critical statistics on grantmaking, boards and governance, investments, and administration—including salary and benefits—for foundations with few or no staff. This blog has an interesting or important finding from each section of our 2024 report. We encourage you to read the entire report, and as always, please contact us with questions.
Equity and Inclusion
The 2023 Foundation Operations and Management Survey (FOMS) showed that very few funders supported disability inclusion. A handful of foundations (i.e., fewer than 5%) implemented any disability inclusion strategy.
Of those that did, the most common strategies were:
- Foundations surveying grantees to learn what disability-inclusive work they were already engaged in (4%)
- Inviting disability activists focused on issues the foundation supports to share their work, challenges, and opportunities with leadership and program staff (4%)

Foundations and philanthropy-serving organizations must center the perspectives of people with disabilities and deepen our understanding of this part of the human experience. Check out the Disability & Philanthropy Forum’s resources and action items to learn more.
Catalytic Leadership in Philanthropy
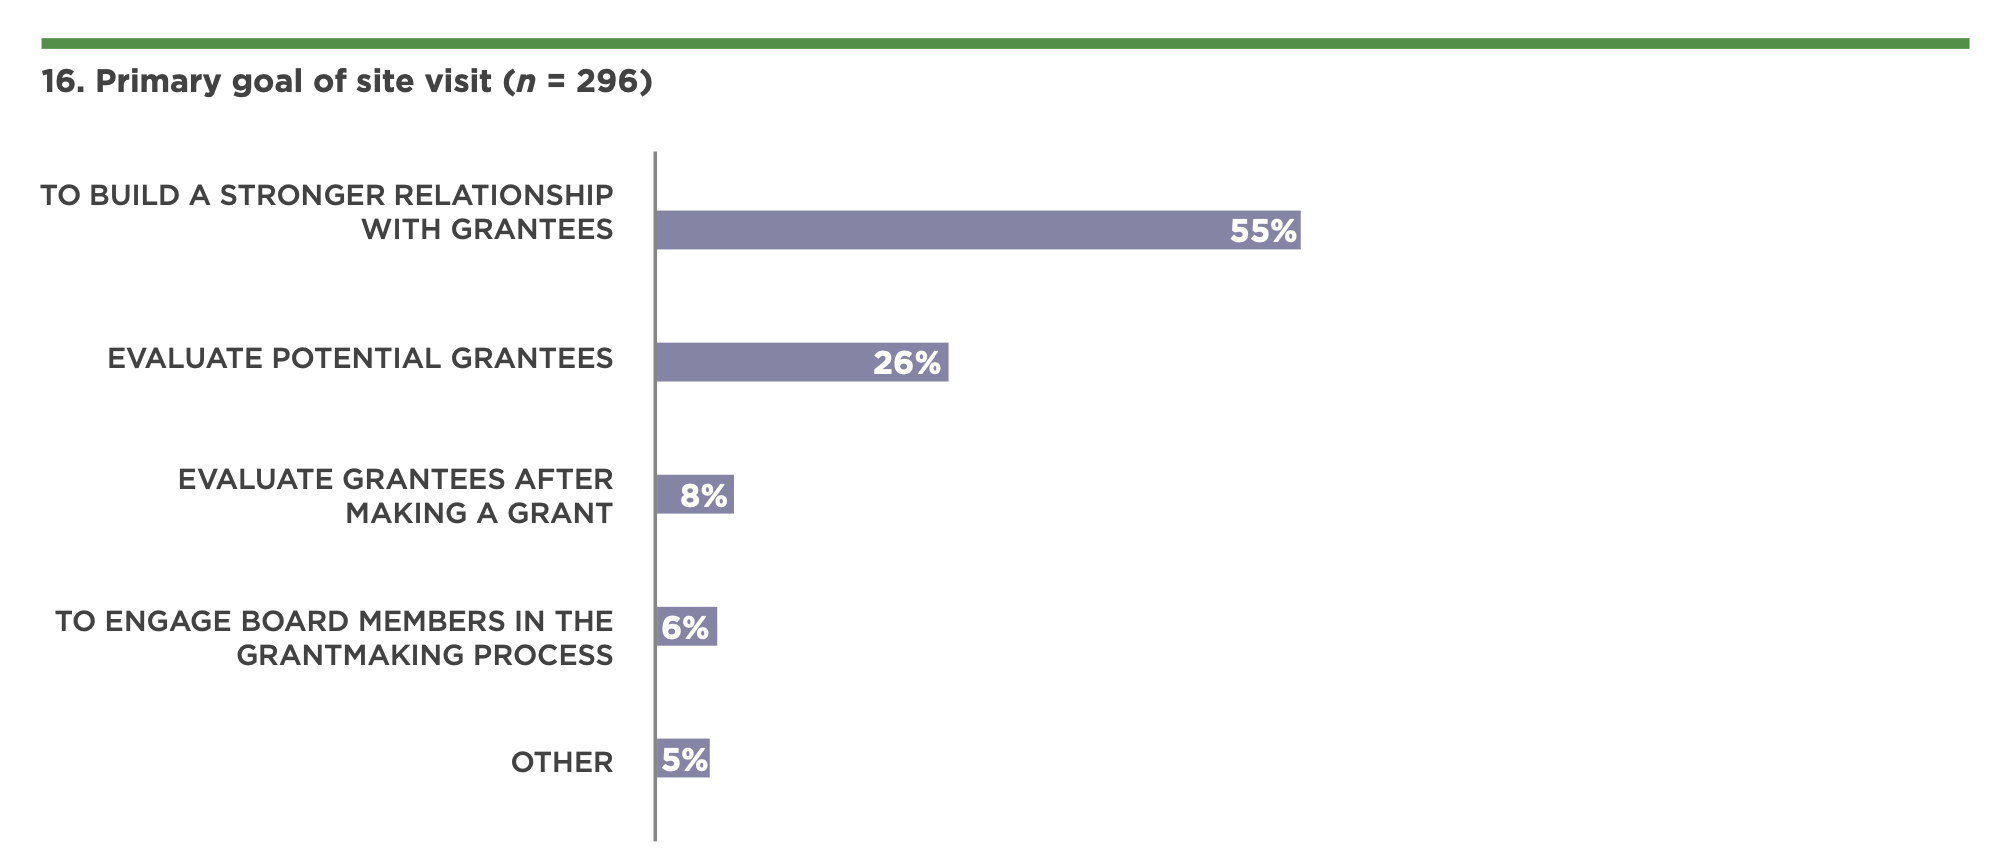
A major component of Catalytic Leadership in Philanthropy (CLIP) is developing skills around deep listening, building strong relationships, and understanding one’s ecosystem to better leverage nongrant assets in support of a foundation’s mission. One key tactic to support these skills is conducting site visits with nonprofits.
The vast majority (85%) of participating foundations conducted site visits in their previous fiscal year. Our data showed that site visits are vital to help foundations build stronger relationships with grantees. The foundation’s primary goal when conducting site visits was to build a stronger relationship with grantees (55%).
Staff, Compensation, and Benefits
Our survey results revealed a pay gap between male and female CEOs/top administrators. Median earnings showed that men received $174,200 compared with women, who received $145,000—a 16.8% difference. Both male and female CEO/top administrator salaries have significantly increased over time.

The CEO/top administrator median salary data available for foundations participating in the 2023 FOMS found that female CEOs/top administrators earned 83 cents for every dollar that male CEOs/top administrators earned in 2022. This means male CEOs/top administrators earned at least $17,000 more than their female counterparts.
The observed pay gap is smaller than the national pay gap. The U.S. Bureau of Labor Statistics found that the median weekly earnings of full-time CEOs/top administrators showed a female-to-male earnings ratio of 78% in 2022.
Board Diversity
Foundation boards continued to lack racial diversity but appeared to show signs of progress. The majority (68%) of foundation boards were entirely comprised of people who identified as White. However, the percentage of foundations with no board members identifying as BIPOC has decreased over time.

One key factor we identified was that board size plays a vital role in the board’s diversity. Foundations with larger boards (i.e., 10 to 14 board members) had a significantly higher percentage of board members who identified as BIPOC than foundations with smaller boards. Foundations with smaller boards (i.e., one to five board members) had a significantly higher percentage of board members who identified as White than foundations with larger boards.
Grantmaking
Foundations are awarding more grants but smaller grants. Our data showed the number of grants awarded by participating foundations increased in the past five years. However, the average grant amount decreased over time, with the lowest average grant amount being awarded in 2020. In contrast, the median grant size has mostly stayed the same over the past five years. We will monitor this trend in future years to see if more clarity emerges.

The increased number of grants could contribute to an increase in qualifying distributions. The qualifying distributions as a percentage of noncharitable-use assets significantly increased from 2021 to 2022 (4.8% and 5.0%, respectively.)
In addition to making more grants, funders are committing more money to general operating support. More than two-thirds (69%) of foundations provided general operating support to grantees. The percentage of the total grantmaking budget allocated for general operating support grants increased significantly in the past five years (44% in 2018 compared with 52% in 2022).

Investments
Most funders (83%) outsourced their investment management. The investment manager model was most common among participating foundations, followed by the investment consultant model and the Outsourced CIO model.

A foundation’s choice of investment management model did not vary significantly by foundation type, asset size, or any other foundation characteristics.
Access the 2024 Foundation Operations and Management Report now »
As a member, you can download an electronic copy of this report for free or purchase a hard copy at a discounted rate. Non-members can download the full Executive Summary for free.
About the Author
Brendan McCormick is the associate director of research and publications at Exponent Philanthropy. He works with members, partners, and staff to develop resources and research on our funder community.